Discharge Reporting & Outcomes Evidence
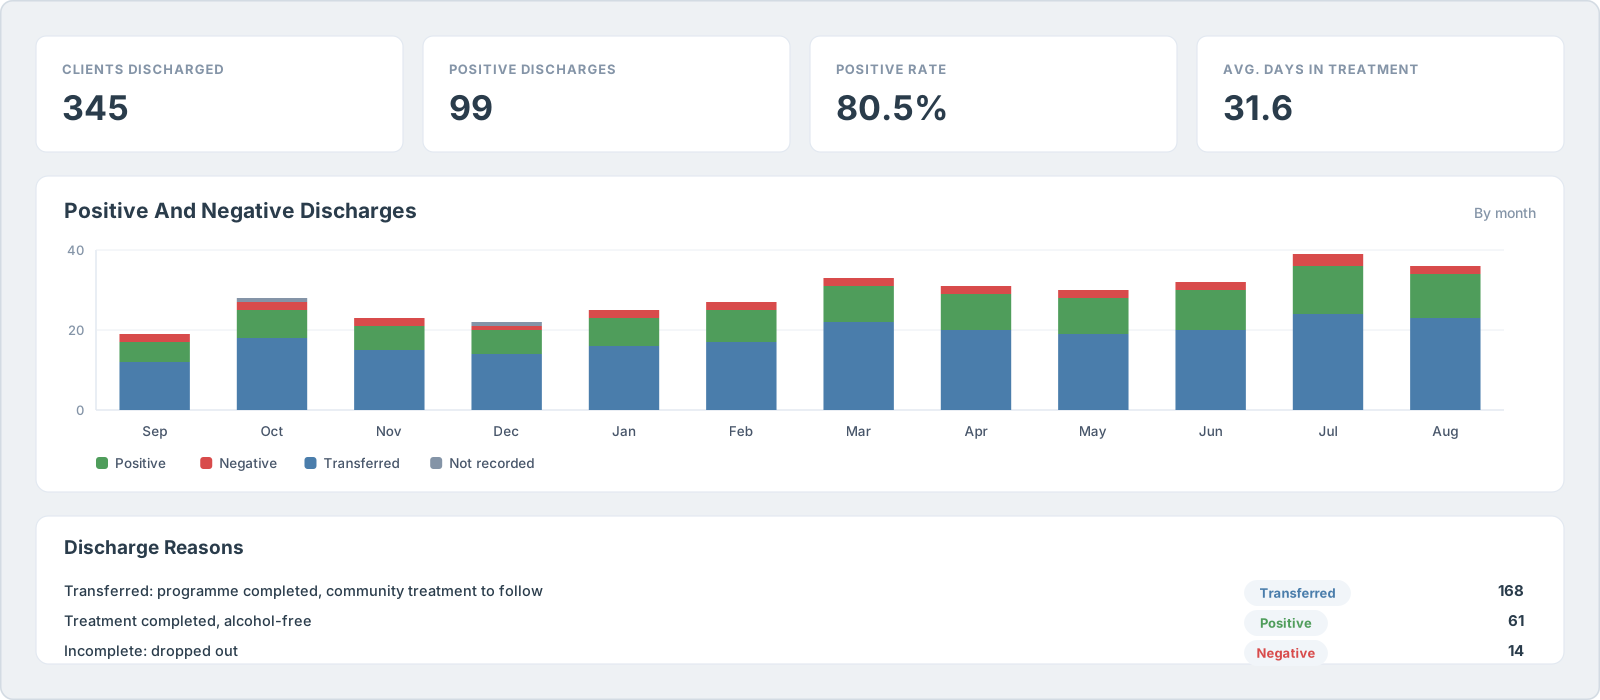
You already know the quality of the care your team delivers. The Discharge Dashboard puts numbers behind it: outcomes, time in treatment and success by main substance, exported as a PDF carrying your own branding, ready to drop straight into a tender, a funding bid or an inspection folder.

Problems you may recognise
The challenges we hear about most from providers like you — and how GreenShoots is built to solve them.
The challenges
You know your service is good, but you cannot prove it
The quality of your care is obvious to the people who work in it and invisible to everyone else. Without outcome figures you can stand behind, a strong service and a struggling one look identical on paper.
Tender deadlines arrive faster than the evidence
Bids ask for completion rates, outcomes and time in treatment over a set period. Reconstructing those numbers by hand in the fortnight before submission is where good services lose contracts to better-documented ones.
Inspectors ask for evidence and get anecdote
CQC inspectors want to see how you know your care is effective. Case studies and staff confidence carry far less weight than a consistent set of figures you can produce on the day and explain.
Your real results look worse than they are
When transfers are counted as failures and unrecorded reasons are silently dropped, your published outcome rate understates the work your team actually did.
How GreenShoots helps
Evidence of what you achieve
Positive, negative and transferred discharges charted over time, with a headline positive rate and average time in treatment. The numbers that turn “we deliver good care” into something a funder can verify.
Tender-ready, under your brand
Run the exact period a bid asks for and export a PDF carrying your service's branding, with the charts, a table of the underlying figures, and a summary of the dates and filters used. It reads as your evidence pack, not a printout from a supplier's system.
Evidence for CQC inspection
Inspectors ask how you know your care is effective. Produce outcomes for any date range on the day, showing the trend, the definitions behind it, and any gaps in the underlying data rather than a tidied-up total.
Your definition of success
A discharge counts as positive or negative according to the Successful flag on your own discharge reasons, which are yours to set. The figures reflect how your service defines a good outcome, so you can defend them.
Transfers counted separately
A client moving on to another service is neither a success nor a failure. Transfers are reported on their own line rather than dragging down a rate you are about to put in front of a commissioner.
Success rate by main substance
Show which pathways work, taken from the Drug 1 field on the client's episode. Substances are listed by number of discharges rather than by rate, so a strong rate over one or two clients cannot flatter the picture.
What's included
Every GreenShoots subscription gives you access to a comprehensive set of tools.
Frequently asked questions
Yes, and that is one of the main reasons providers use it. Run the exact period a bid asks for and export a PDF carrying your own branding, containing the charts, a table of the underlying figures, and a summary of the dates, sites and filters used. It goes into the submission as your document, and an evaluator can see how each number was produced rather than having to take it on trust.
It gives you the outcome evidence inspectors ask for when they want to know how you assure yourselves that care is effective. You can produce discharges, outcomes and time in treatment for any date range on the day of an inspection, show the trend over time, and explain the definitions behind the figures. It is evidence you present, not a compliance guarantee; the judgement remains the inspector's.
It follows your own definitions. A discharge counts as positive or negative according to the Successful flag on your own discharge reasons, which you control under Settings. If your view of a good outcome changes, update the flag and the dashboard follows, so the figures you publish are ones you can defend.
Separately. Discharge reasons flagged as a transfer are reported on their own line rather than being counted as a success or a failure, because a client moving on to another service is neither. The positive rate is calculated from positive and negative discharges only.
They are reported, not hidden. If a discharge reason has not been set up under Discharge Reasons, the dashboard tells you how many discharges it could not classify and how to bring them into the figures, so you always know whether a number reflects your service or a gap in the data.
Yes. Success rate is broken down by main substance, taken from the Drug 1 field on the client's episode. Substances are listed by number of discharges rather than by rate, so a high rate across one or two clients does not float to the top; you read the rate against the discharges beside it.
Yes. Quarterly breakdowns are counted from your financial year, so April to June is reported as Q1 rather than Q2, and the figures line up with the rest of your reporting.
Yes. The whole dashboard downloads as a CSV, or as a branded PDF with every chart exactly as shown on screen, a table of the underlying figures, and a summary of the dates and filters used, so the numbers can be checked rather than taken on trust.
Providers already doing this
Services using GreenShoots for exactly this, in their own words.
Further reading
Commissioner and operations guides from the GreenShoots team.
Related Solutions
Explore how GreenShoots supports other areas of your service.
Referral Management & Reporting Software
Track every referral from enquiry to admission. See which referrers send them, how long each queue takes, and why referrals are cancelled. Book a demo.
Learn moreReporting & Outcomes Software for Care
30+ built-in reports, Outcome Star, and Power BI integration for commissioners and boards. Explore reporting in a tailored demo.
Learn moreOutcome Stars Software for Care Providers
Built-in GreenShoots Outcome Stars — capture wellbeing assessments in the case record, track progress, and report outcomes. Included with your subscription.
Learn moreAddiction Treatment Case Management Software
Substance misuse case management with automated NDTMS, care plans, and CQC-ready audit trails. See how UK treatment providers use GreenShoots.
Learn moreRehab Case Management Software UK
Residential rehab software with eMAR, admissions, and NDTMS built in. See admission-to-discharge workflows on a live walkthrough.
Learn moreAutomated NDTMS Reporting Software
Generate validated NDTMS datasets from Episodes, TOPs, SIRs, and CIRs in one click. See the dataset generator in a free demo.
Learn moreReady to see how GreenShoots works?
Book a free, personalised demo. We'll show you exactly how GreenShoots fits your service.